Cost per Lens: What a Finished Optic Really Costs to Make
The fastest machine in a quotation does not necessarily produce the lowest-cost finished optic. It may feed a slower station, require frequent intervention or create parts that fail after polishing. Cost per lens should be calculated per accepted finished part over a defined production period.
Build the calculation from actual material, labor, consumables, equipment, quality and support costs. Keep assumptions visible and compare the same finished-part requirement. A lower cycle time has value only when it increases useful output or releases a resource that the business can use.
01 — Define the boundary of cost per lens
Decide what “finished” means before calculating a number. A ground blank, polished uncoated lens and inspected coated lens are different products. Define the drawing revision, inspection stage and packaging or shipment boundary.
Then choose a period long enough to include normal operating variation. A short demonstration may exclude tool changes, cleaning and a difficult changeover. A production month may include maintenance or exceptional events that should be identified separately rather than silently removed.
Use total cost within the chosen boundary divided by accepted output from the same boundary. Do not divide this month’s costs by a shipment quantity that includes inventory made earlier without reconciling the inventory movement.
The optical fabrication line overview helps map the operations. Add outsourced processing and inspection to that map so they do not disappear from the comparison.
02 — Build six cost categories with no overlap
A practical cost per lens model can use the following categories. The accounting detail can vary, but each expense should appear once.
| Category | Include | Common omission or double count |
|---|---|---|
| Material | Purchased stock, attributable freight and agreed scrap recovery | Ignoring kerf, trims and rejected blanks |
| Direct labor | Loading, setup, inspection and routine intervention | Charging the same operator fully to several machines |
| Consumables | Abrasives, slurry, liquid replacement and fixtures consumed | Counting the same item in maintenance and tooling |
| Equipment ownership | Depreciation or an agreed ownership allocation | Mixing full purchase cost with annual depreciation |
| Quality and rework | Reinspection, rework effort and relevant quality costs | Treating reworked parts as free accepted output |
| Facility and support | Utilities, maintenance and allocated support services | Hiding extraction, cleaning and waste costs |
Define how shared costs are allocated. Keep the rule consistent between alternatives. Otherwise, one machine can appear cheaper simply because more of its work has been moved into an uncounted department.
03 — Yield changes the denominator
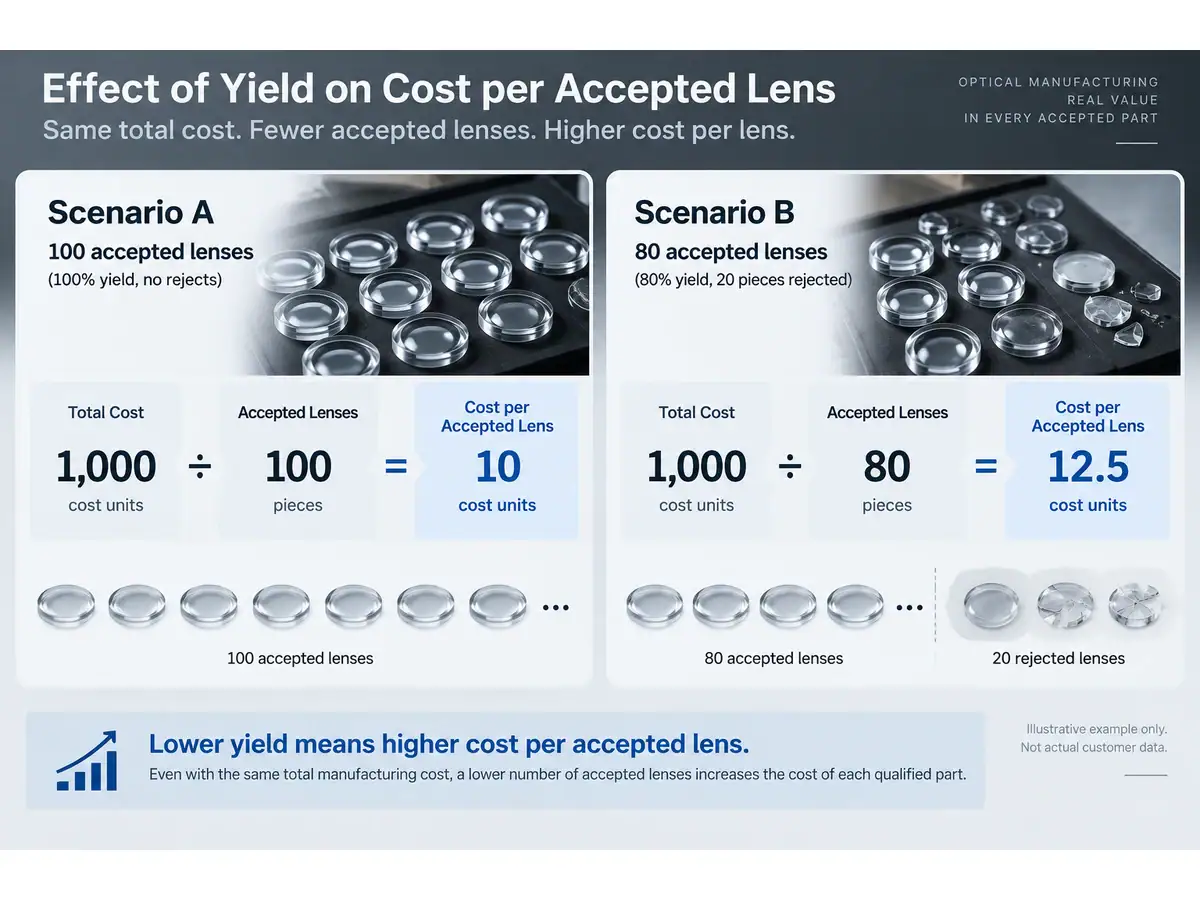
If a batch incurs 1,000 cost units and produces 100 accepted parts, the cost is 10 units per accepted part. If the same incurred cost produces only 80 accepted parts, the value becomes 12.5. This is an illustrative arithmetic example, not a measured Vimfun production result.
The example shows why yield must stay in the denominator. In reality, costs may also change with scrap location and rework. A rejected incoming blank has accumulated less processing cost than a lens rejected after coating.
Track losses by operation and reason. The optical lens yield guide is relevant to that process view. Multiplying stage yields can describe a simple sequential route, but rework loops, mixed lots and inspection escapes require a more explicit flow model.
For cost per lens, count an accepted reworked part once while retaining the extra work and consumables in the numerator. Counting it as a new start and a new finished part can inflate output artificially.
04 — Distinguish cycle time from line output
Machine cycle time is only part of elapsed production time. Loading, measurement, cleaning, tray exchange, planned maintenance and recovery from interruptions also consume capacity.
Map the bottleneck for the actual product mix. Speeding up an upstream machine may only increase work waiting in front of the next station. The result can be more inventory and handling without additional accepted output.
Calculate cost per lens using the available production hours and demonstrated throughput, not the theoretical maximum of every machine added together. Where two operations overlap, model that overlap explicitly. Where an operator must visit several machines, include travel and competing tasks.
A specification for an inspection station is not a finished-line capacity guarantee. Part geometry, measurement settings, loading and rejection handling can change the achieved rate. Use the selected configuration and representative parts in the trial.
05 — Measure consumables over useful production
Wheel price is not wheel cost per part. Divide the attributable tool cost by the accepted output obtained under the defined use and replacement policy. Include dressing and conditioning losses where they consume tool life or production time.
Apply the same approach to polishing media and process liquids. A longer change interval may reduce purchase cost while increasing contamination, unstable removal or cleaning work. Evaluate the complete effect rather than extending an interval simply to make one ledger line smaller.
Fixture wear can also change cost per lens. A fixture may remain mechanically usable while its seating repeatability becomes unsuitable for the drawing. Define inspection and replacement criteria so the model does not assume infinite tooling life.
Keep consumable performance tied to the material and geometry. A favorable result on a thick optical-glass blank cannot automatically price the production of a thin sapphire component.
06 — Calculate automation payback with net savings
Simple payback can be expressed as installed investment divided by annual net cash savings. Both terms need a clear boundary. Installed investment may include feeders, fixtures, integration, training and facility changes, not just the robot or loader price.
Annual net savings should subtract added maintenance, software, energy and support costs. Labor time saved becomes cash saving only when it reduces paid time, avoids a hire or can be reassigned to productive work that has value. Freed minutes scattered across a shift may not remove a whole labor position.
For illustration, an installed investment of 60,000 cost units and annual net savings of 20,000 imply a three-year simple payback. This example excludes financing, discounting, taxes and residual value. It is a calculation format, not an equipment quotation or predicted return.
Test the cost per lens result under lower volume, longer changeover and weaker yield than the optimistic case. A proposal that works only at maximum utilization needs careful review before approval.
07 — When automation is the wrong first purchase
Do not automate an unstable process merely to reduce operator involvement. If the incoming blanks vary, fixtures require frequent adjustment or the acceptance method is unresolved, automation may reproduce the problem faster and make recovery more complicated.
High product variety and short batches can also weaken the case. A manual or semi-automatic station with rapid, verified setup may outperform a fully automated cell that spends much of its time waiting for new trays and programs.
Estimate the realistic yearly demand by part family. Include demand variability and the time needed to introduce new drawings. If the projected labor saving cannot cover integration and support under that workload, improve tooling, measurement or flow first.
An honest cost per lens comparison should retain this rejection option. The objective is a reliable production system, not the maximum number of automated movements.
08 — Compare quotations and trials on the same basis
Ask each supplier to identify included tooling, loading, inspection and support equipment. The grinding machine price guide explains the configuration questions that should be settled before comparing purchase prices.
Use one calculation sheet with separate columns for observed values and assumptions. Record the source and date of each important input. A brochure cycle, a quoted consumable price and a customer trial result should not look identical in the model.
Define the acceptance run that will confirm the most sensitive assumptions: output, yield, changeover and operator involvement. Keep the raw run log so the buyer can reproduce the calculation afterward.
Send the drawing, material, annual volume, batch pattern and existing bottleneck for an application and cost review. The useful outcome is a cost per lens estimate tied to a specific process and evidence, with uncertainty visible before the purchase decision.